KPI Dashboard
Project Overview:
KPI Dashboard is an internal management tool for consulting the KPIs of the company

Objectives
- Apply data analitycs to develop the KPIs of the company
- Filter and clean data with store Procedures on MySQL
- Develop a user-friendly analytcis web app with graphs and filter
Features
- Apply data analitycs to develop the KPIs of the company:
- Identify key performance indicators that align with the company’s goals.
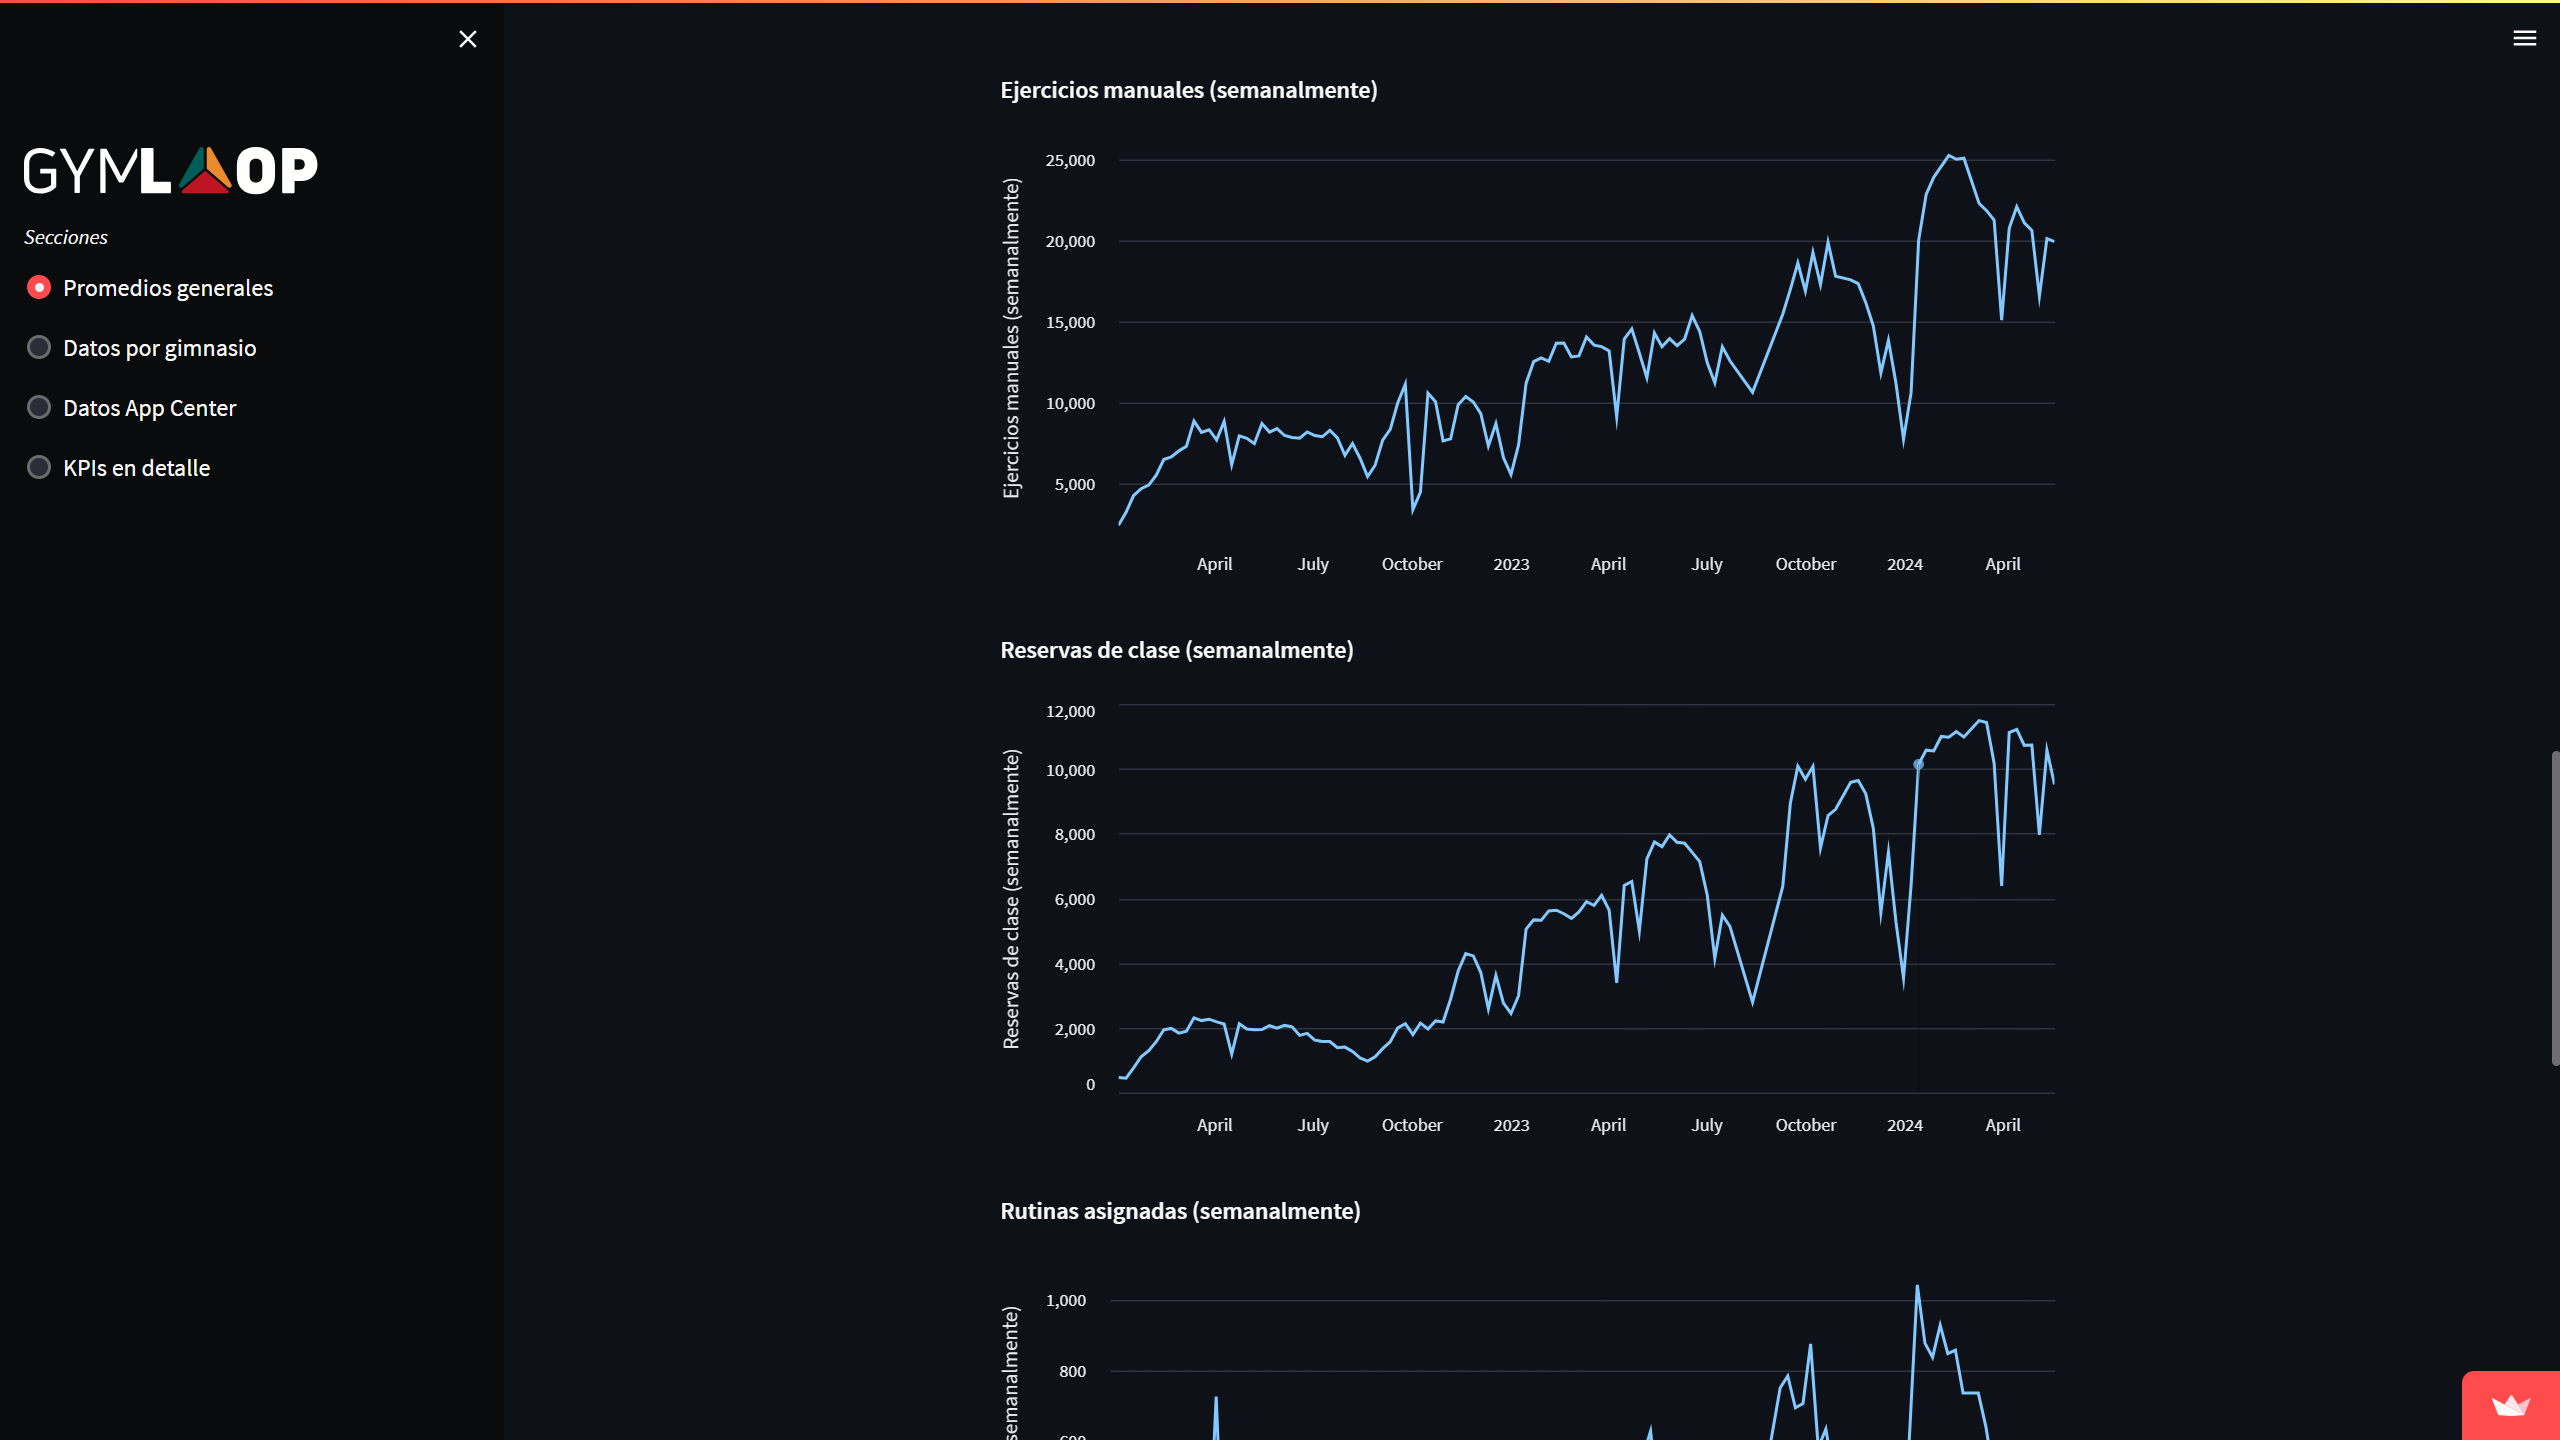
- Use statistical methods to analyze performance trends.
- Provide insights into membership growth, staff efficiency, and gym usage.

- Filter and clean data with store Procedures on MySQL:
- Implement stored procedures to automate data cleaning processes.
- Ensure data integrity and accuracy through validation checks.
- Optimize database queries for faster data retrieval.

- Develop a user-friendly analytcis web app with graphs and filter:
- Design an intuitive interface using Python and Streamlit.
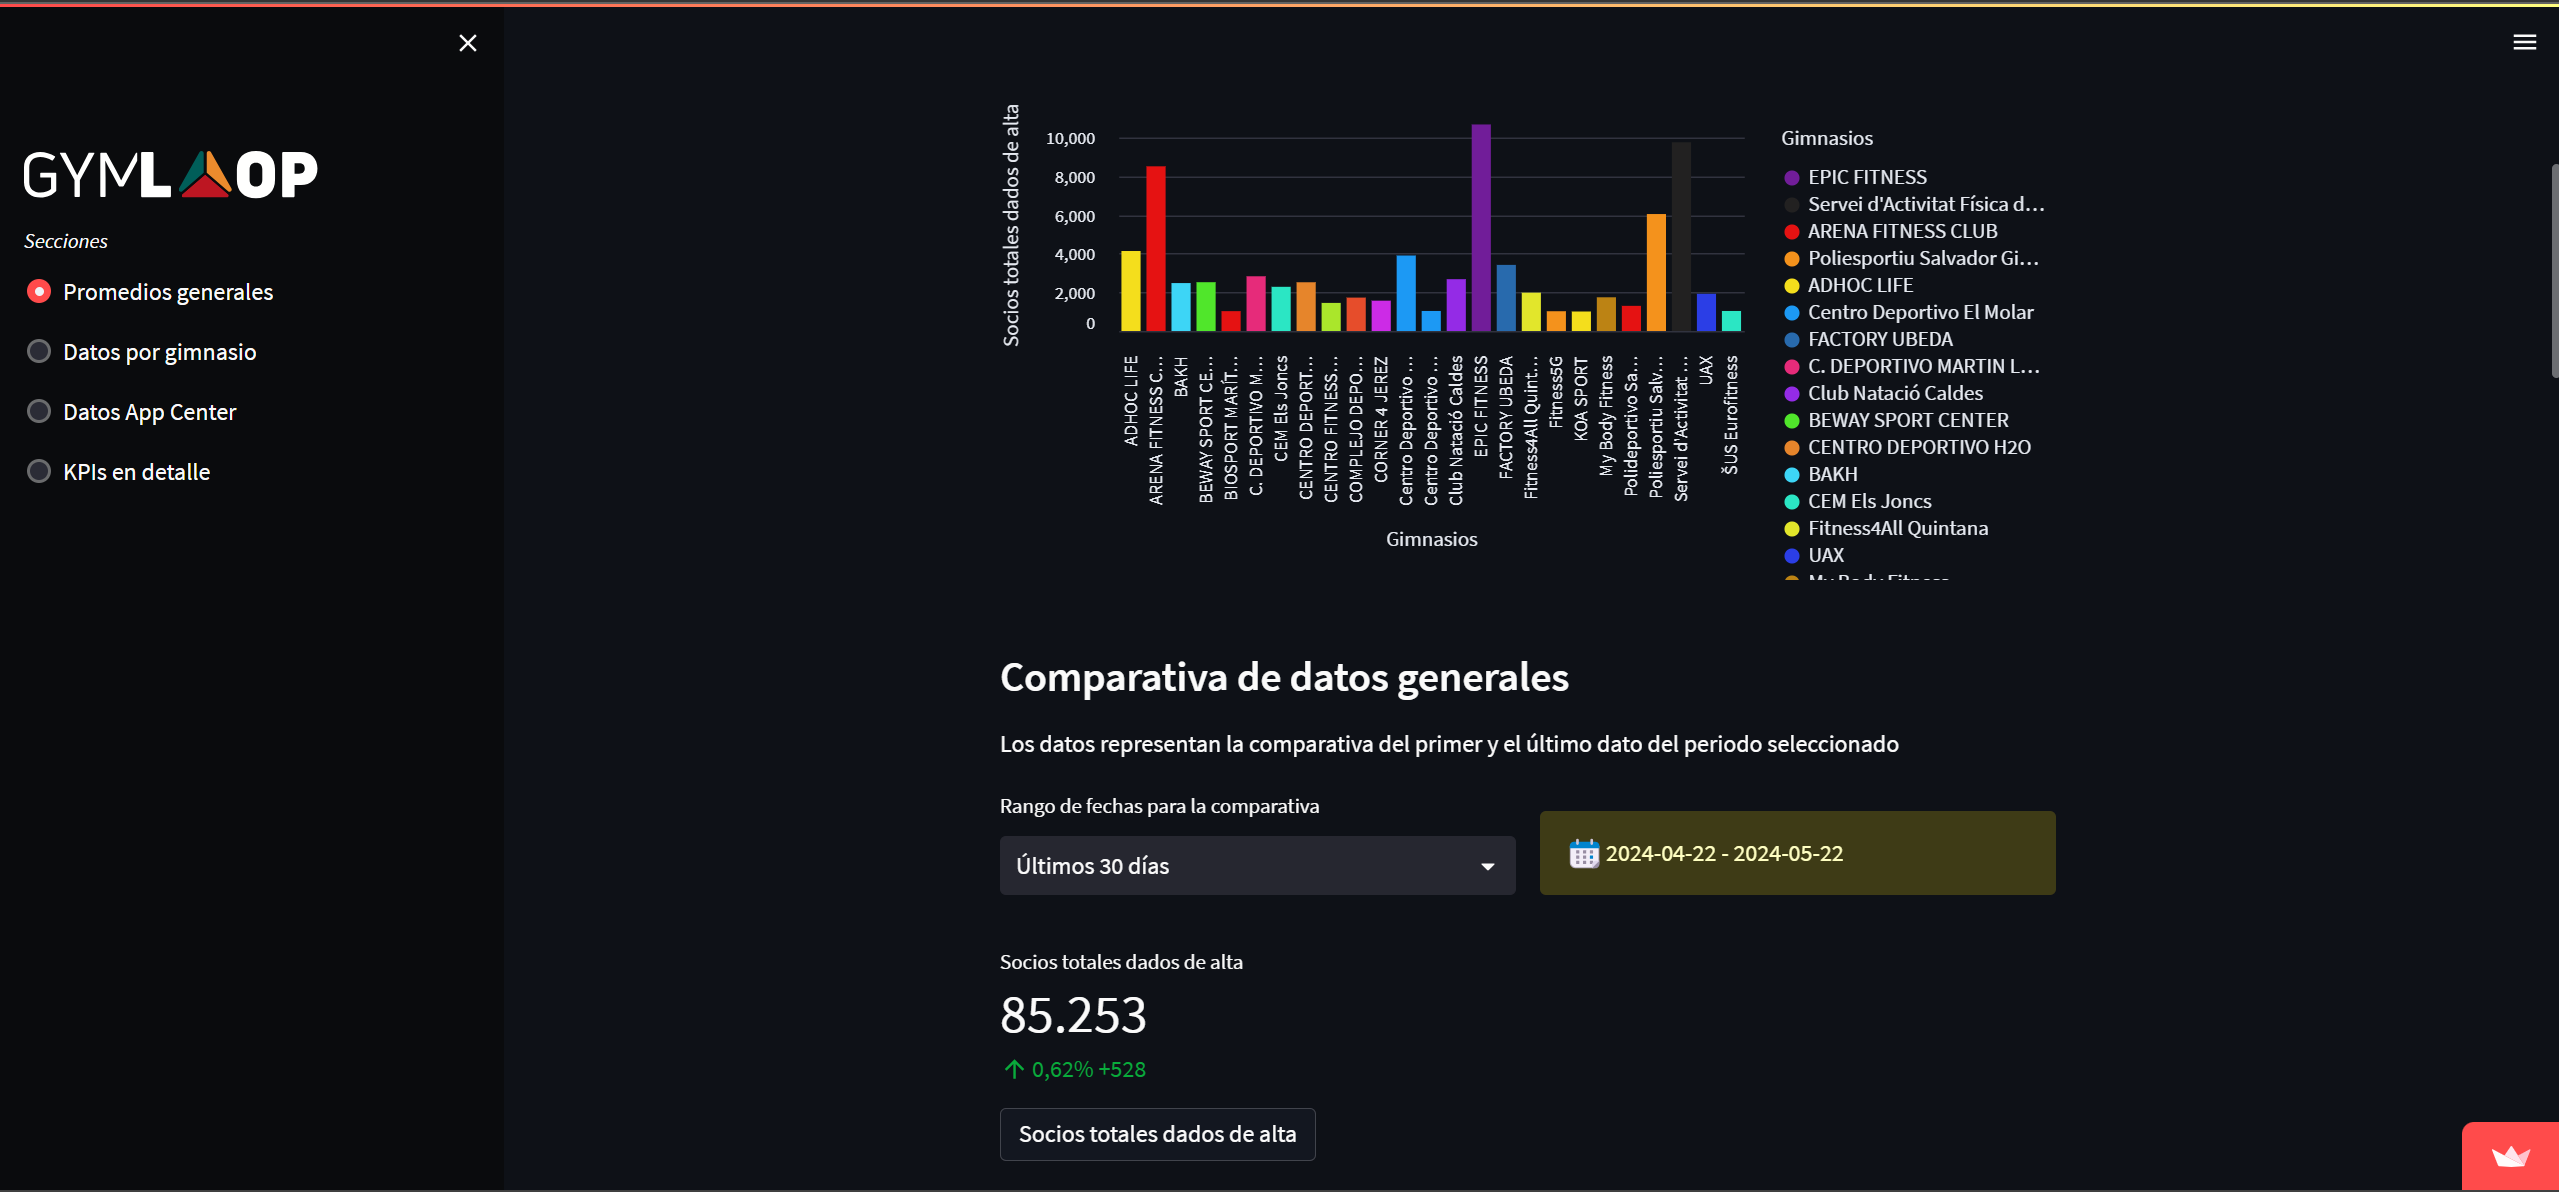
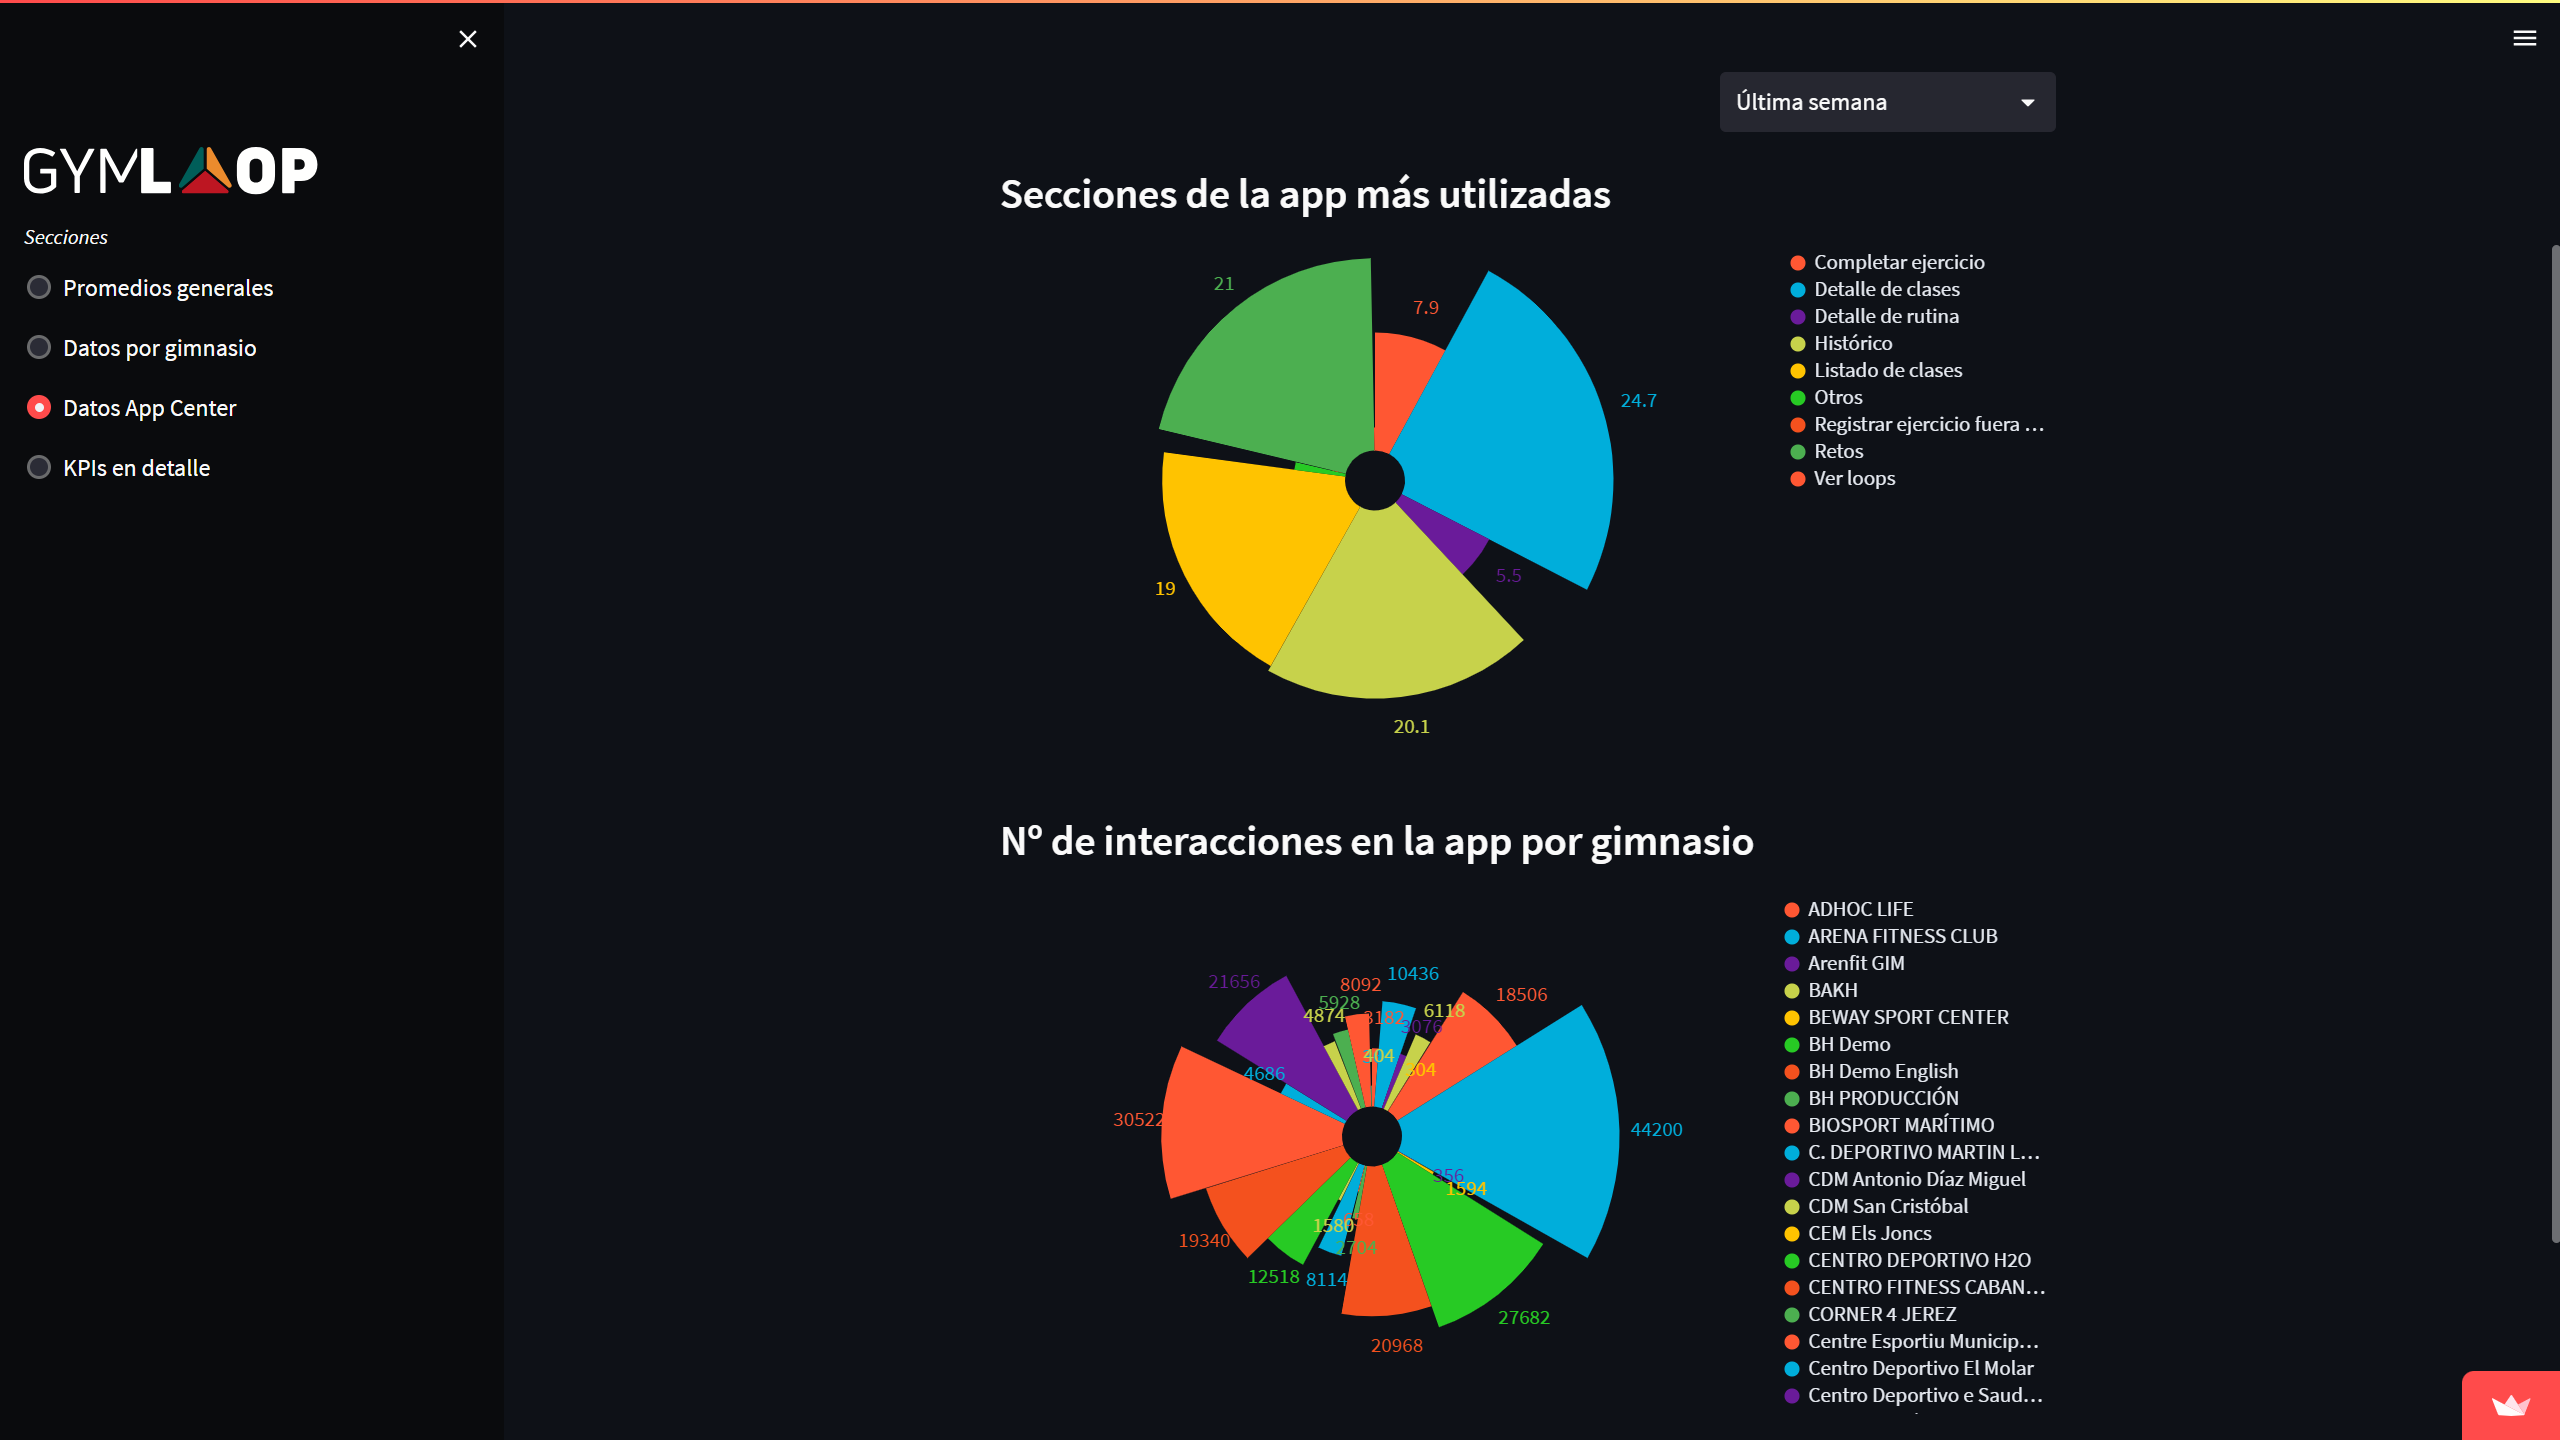
- Integrate interactive graphs and charts for data visualization.
- Allow users to filter data based on various parameters for custom reports.
Technology Stack
- Frontend: Python / Streamlit
- Database: MySQL Store Procedures
Outcome
The KPI Dashboard successfully enabled the fitness company to monitor and manage their key performance indicators effectively. The use of data analytics provided valuable insights into various aspects of the business, leading to more informed decision-making. The stored procedures in MySQL ensured that the data was clean and reliable, while the user-friendly web app made it easy for management to visualize and interact with the data. This resulted in improved operational efficiency and strategic planning for the company.